Audit trail in Space
Introducción
The Audit trail information screen shows a list of events for each access point and their associated devices. Each event has a date and time stamp. By default, it shows events for the previous seven days only. To see earlier events, you must define the specific date range in the Date/Time filter (Funnel icon). See Filtering audit trail data for more information.
The audit trail and system auditor track different system information. The System auditor information screen shows system and operator events. The Audit trail information screen shows events related to access points and their associated devices, like nodes or relays.
See Collecting audit trail data from offline doors for information about how to collect audit trail data from offline doors.
You can view the audit trail information by selecting Monitoring > Audit trail.
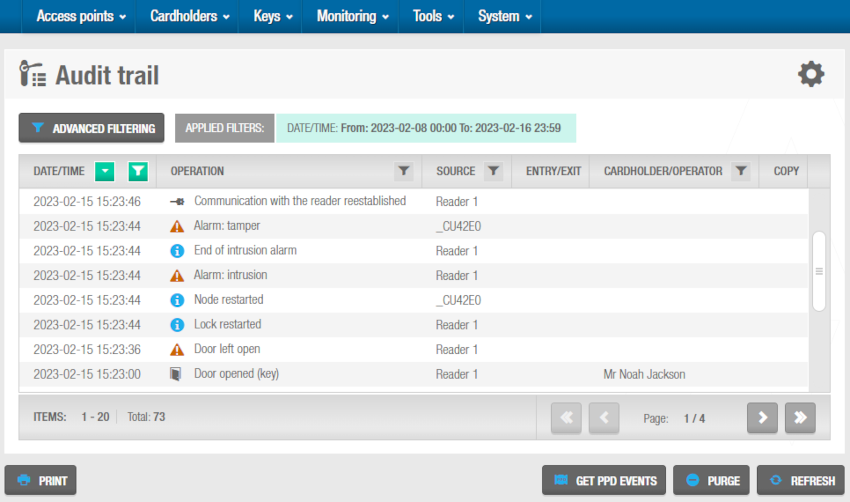 'Audit trail' information screen
Restricting audit trail data
You can restrict the type of data that is displayed in the audit trail by selecting the Disable collection of personal registries on audit trail checkbox in the General tab within System > General options. When you select this option, operators can view entries for lock and key updates but not opening and closing events, or failed access attempts. See General options for more information.
Printing and exporting audit trail lists
You can select Monitoring > Audit trail and click Print on the Audit trail information screen to print a hard copy of the audit trail list, or export the list to a specified file format. See Exporting data in Space for more information and a description of the steps you should follow.
Filtering audit trail data
You can filter the audit trail data by event date/time, operation, source, and cardholder/operator.
See Audit trail filters for more information.
To filter the audit trail data, follow the steps below:
Select Monitoring > Audit trail. The Audit trail information screen is displayed.
Click the funnel icon above the filter item. A search dialog box is displayed.
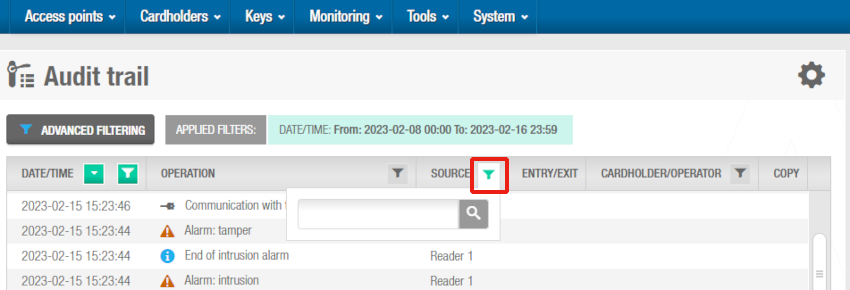 You can filter the audit trail data by clicking the funnel icon
For example, if you want to filter by device name, click the Funnel icon at the top of the Source column. For the Operation filter, you can see a predefined drop-down list of search terms by clicking on the down arrow in the dialog box. For the Date/Time range, you can define a date range by using the From and To fields.
- Type your search term.
Or
Select a predefined search term from the drop-down list.
Or
Select a date range.
You can apply multiple filters. The applied filters are displayed, highlighted in green, at the top of your screen. You can click the Close icon on an applied filter to remove it. However, you cannot remove the Date/Time filter.
- Click the Search icon. A filtered audit trail list is displayed.
Audit trail filters
You can use the Audit trail information screen filters to display only certain events. The options are described in the following table.
| Audit data filters | Descripción |
|---|---|
| Date/time | Date and time when the event took place |
| Operation | Details of the event, for example, door opened, CU updated, relay activated by alarm, etc. |
| Source | Source name of the device which produced the event, for example, which door was opened |
| Cardholder/Operator | User name of the person who caused the event, for example, the name of the user who opened the Financial Services office door |
- Customizing Audit trail filters
These filter columns in the Audit trail screen can be customized by clicking on the Customize table icon.
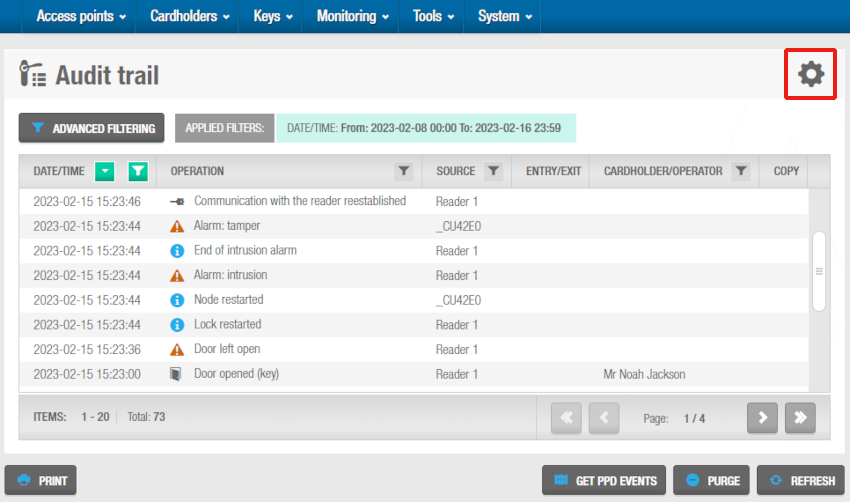 'Customize table' icon in the 'Audit trail' screen
The Customize table dialog box displays and you can choose which columns will be shown and their order.
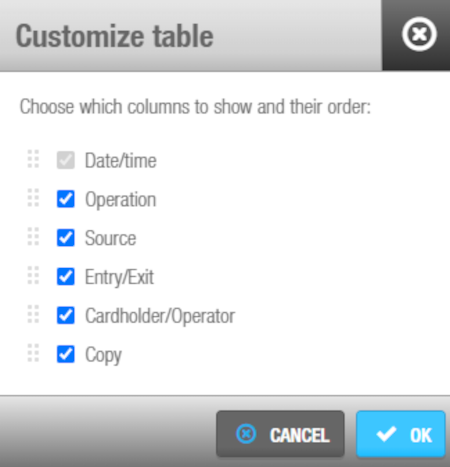 You can choose which columns will be shown in the 'Audit trail' screen
Advanced filtering
You can configure advanced filters and apply them to audit trail data. You can also save any advanced filters that you create.
You can filter audit trail events by the following:
- Cardholders, operators, and/or access levels
- Access points, zones, nodes, alarm inputs, and/or relays
- Operations and/or operation groups
- Date and time period
The sections below describe how to complete each step in this process.
- Step one: Adding filter details
To complete Step one:
Select Monitoring > Audit trail. The Audit trail information screen is displayed.
Click Advanced filtering. The Advanced filtering screen is displayed.
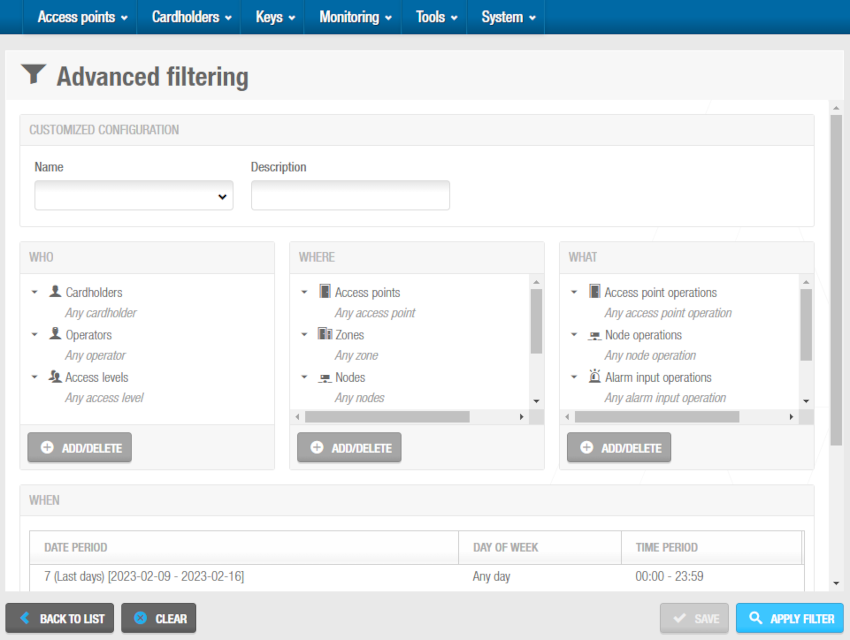 You can configure advanced filters and apply them to audit trail data
Type a name for the filter in the Name field and a description in the Description field.
Select the appropriate partition from the Partition drop-down list, if required. See Partitions for more information. The filter is only applied to the partition you select.
Note that the partitions functionality is license-dependent. See Registering and licensing Space for more information.
- Step two: Selecting filter parameters
To complete Step two:
Click Add/Delete in the Who panel. The Add/Delete dialog box, which contains a list of cardholders, operators, and access levels on three tabs, is displayed.
The selected cardholders are displayed in the right-hand panel. Double-click the required cardholders in the left-hand panel or select them and click the chevron.
You can hold down the Ctrl key while clicking the fields to make multiple selections. As soon as you select a cardholder, the default Any cardholder option is automatically moved to the left-hand panel. You can use the default option if you want to view audit trail data for all the cardholders in the system.
Click the Operators tab if you also want to filter by operator. A list of operators is displayed.
Select the required operators in the left-hand panel and click the chevron. The selected operators are displayed in the right-hand panel.
Click the Access levels tab if you also want to filter by access levels. A list of access levels is displayed.
Select the required access levels in the left-hand panel and click the chevron. The selected access levels are displayed in the right-hand panel.
Click Accept. The selected cardholders, operators, and access levels are displayed in the Who panel.
Follow the procedure described in Steps 1 to 7 to add the access points, zones and other associated devices you want to filter to the Where panel.
Follow the procedure described in Steps 1 to 7 to add the operations and operation groups you want to filter to the What panel.
- Step three: Specifying filter date periods
To complete Step three:
- Click Add/Delete in the When panel. The Add/delete periods dialog box, showing the default period, is displayed.
The default period is any time in the previous seven days.
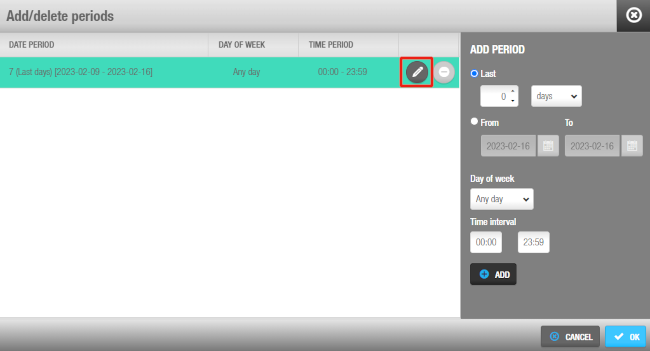 'Add/delete periods' dialog box
Click the Edit icon to change the date period and time interval if required. You can also click Add to add additional periods. For example, you can add a period to filter the audit trail data between 09:00 and 11:00 each day within a specified date period, and add another period to filter the audit trail data between 14:00 and 17:00 each day within the same date period.
Click Accept when you have finished editing or adding periods. The changes are displayed in the When panel.
Select the Any partition or Some partitions option in the Partitions panel. See Partitions for more information about partitions. If you select the Some partitions option, you must select the appropriate partitions from the list.
Click Apply Filter. The Audit trail information screen, showing the relevant entries and the name of the advanced filter, is displayed. You can also click Save to save the filter you have created. You can click Advanced filtering or the name of the advanced filter on the Audit trail information screen to return to the Advanced filtering screen and change the filter configuration or save the filter. When you save a filter, it is automatically added to the drop-down list in the Name field on the Advanced filtering screen. To view a saved filter, select it from the drop-down list.
You can also filter audit trail data by using the events stream functionality in Tools.
Purging audit trail data
Purging the audit trail removes all audit trail data within a selected time frame from the system, so that your system has more space available. The purged data is saved to a text file in a specified folder location.
Automatic purges of the audit trail are scheduled by default. See Automatic audit trail purging for more information.
To purge the audit trail, do the following:
Select Monitoring > Audit trail. The Audit trail information screen is displayed.
Click Purge. The Purge audit trail dialog box is displayed.
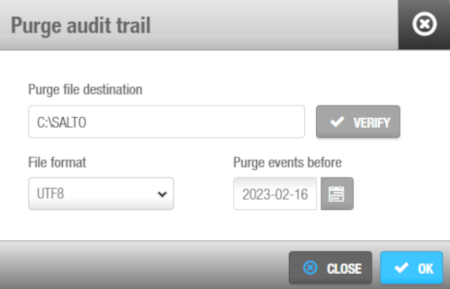 'Purge audit trail' dialog box
Type the appropriate destination folder name in the Purge file destination field. You can click Verify to verify the file directory exists and is correct.
Select a format from the File format drop-down list. This specifies the format and defines the encoding of the file containing the purged events. For example, this defines how special characters, such as "ä", "ö", "ü" or "ß", are stored and handled.
Select the required date by using the calendar in the Purge events before field. All events prior to the date you select are purged.
Click OK. A pop-up is displayed confirming the operation was completed successfully.
Click OK.
